From scattered data to useful decisions.
Custom reporting portals, operational dashboards and automated reports that help teams understand the numbers without wrestling with spreadsheets.
Reporting designed around real workflows.
From a focused KPI screen to a secure, data-rich reporting portal.
Operational dashboards
Clear KPI summaries, filters, trends, status indicators and drill-down views for day-to-day decisions.
SQL Server reporting
Structured queries, stored procedures, data models and reliable reporting endpoints for existing business databases.
Automated reports
Scheduled or on-demand exports, PDF documents and repeatable reporting workflows that reduce manual preparation.
Data integration
Bring together data from applications, APIs and existing systems, with attention to provenance and refresh behaviour.
Management reporting portals
Role-appropriate reporting interfaces, searchable records and practical export options.
Reporting improvements
Improve slow queries, confusing layouts, duplicated logic and fragile spreadsheet-based reporting processes.
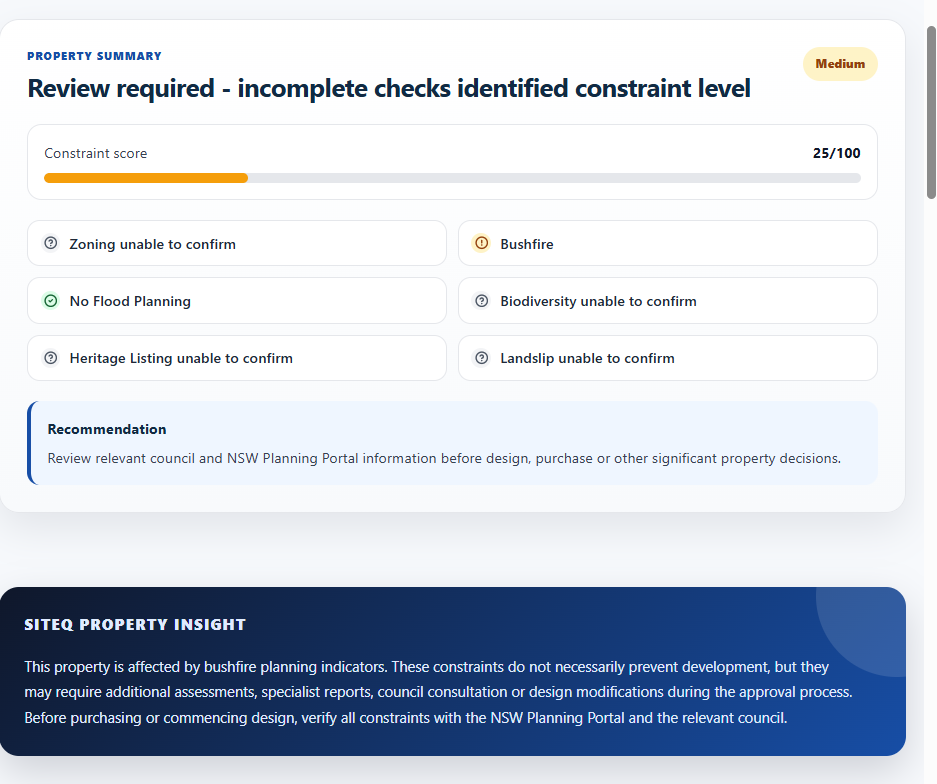
Reporting capability demonstrated by SiteQ.
SiteQ assembles multiple planning datasets into structured property insights, interactive maps and automated PDF reports.
The product demonstrates data orchestration, conditional reporting, visual presentation and end-to-end delivery—not a generic dashboard template.
Have a report that takes too long to prepare?
Send an example output, a description of the data source and the decisions the report should support. We can assess a focused, written scope.